Both MNQ and MES sold off today, and side by side they're a clean lesson in reading past a misleading verdict. Here's the kicker: both opened with the IB Verdict flashing LONG DAY — the opening range closed up in its top quartile on each — and both turned into short days. The value-area read is what told the real story, and it told it differently on each one.
The trap they shared
On both charts the IB Verdict read LONG DAY (close > 75% line). Taken by itself, that's a bullish lean — the opening range finished strong. If that's all you looked at, you'd have been leaning the wrong way all session. This is exactly why I treat the IB Verdict as one input, not the trade. The value-area rows are where each day actually showed its hand.
MNQ — migration lower, straight off the open
MNQ made it easy. It opened at 29710.50 — BELOW prior value (pVAL) and never looked back. The VA Verdict read MIGRATION LOWER — no fade: value was moving down, and the study was flat-out telling you not to try to catch the dip.
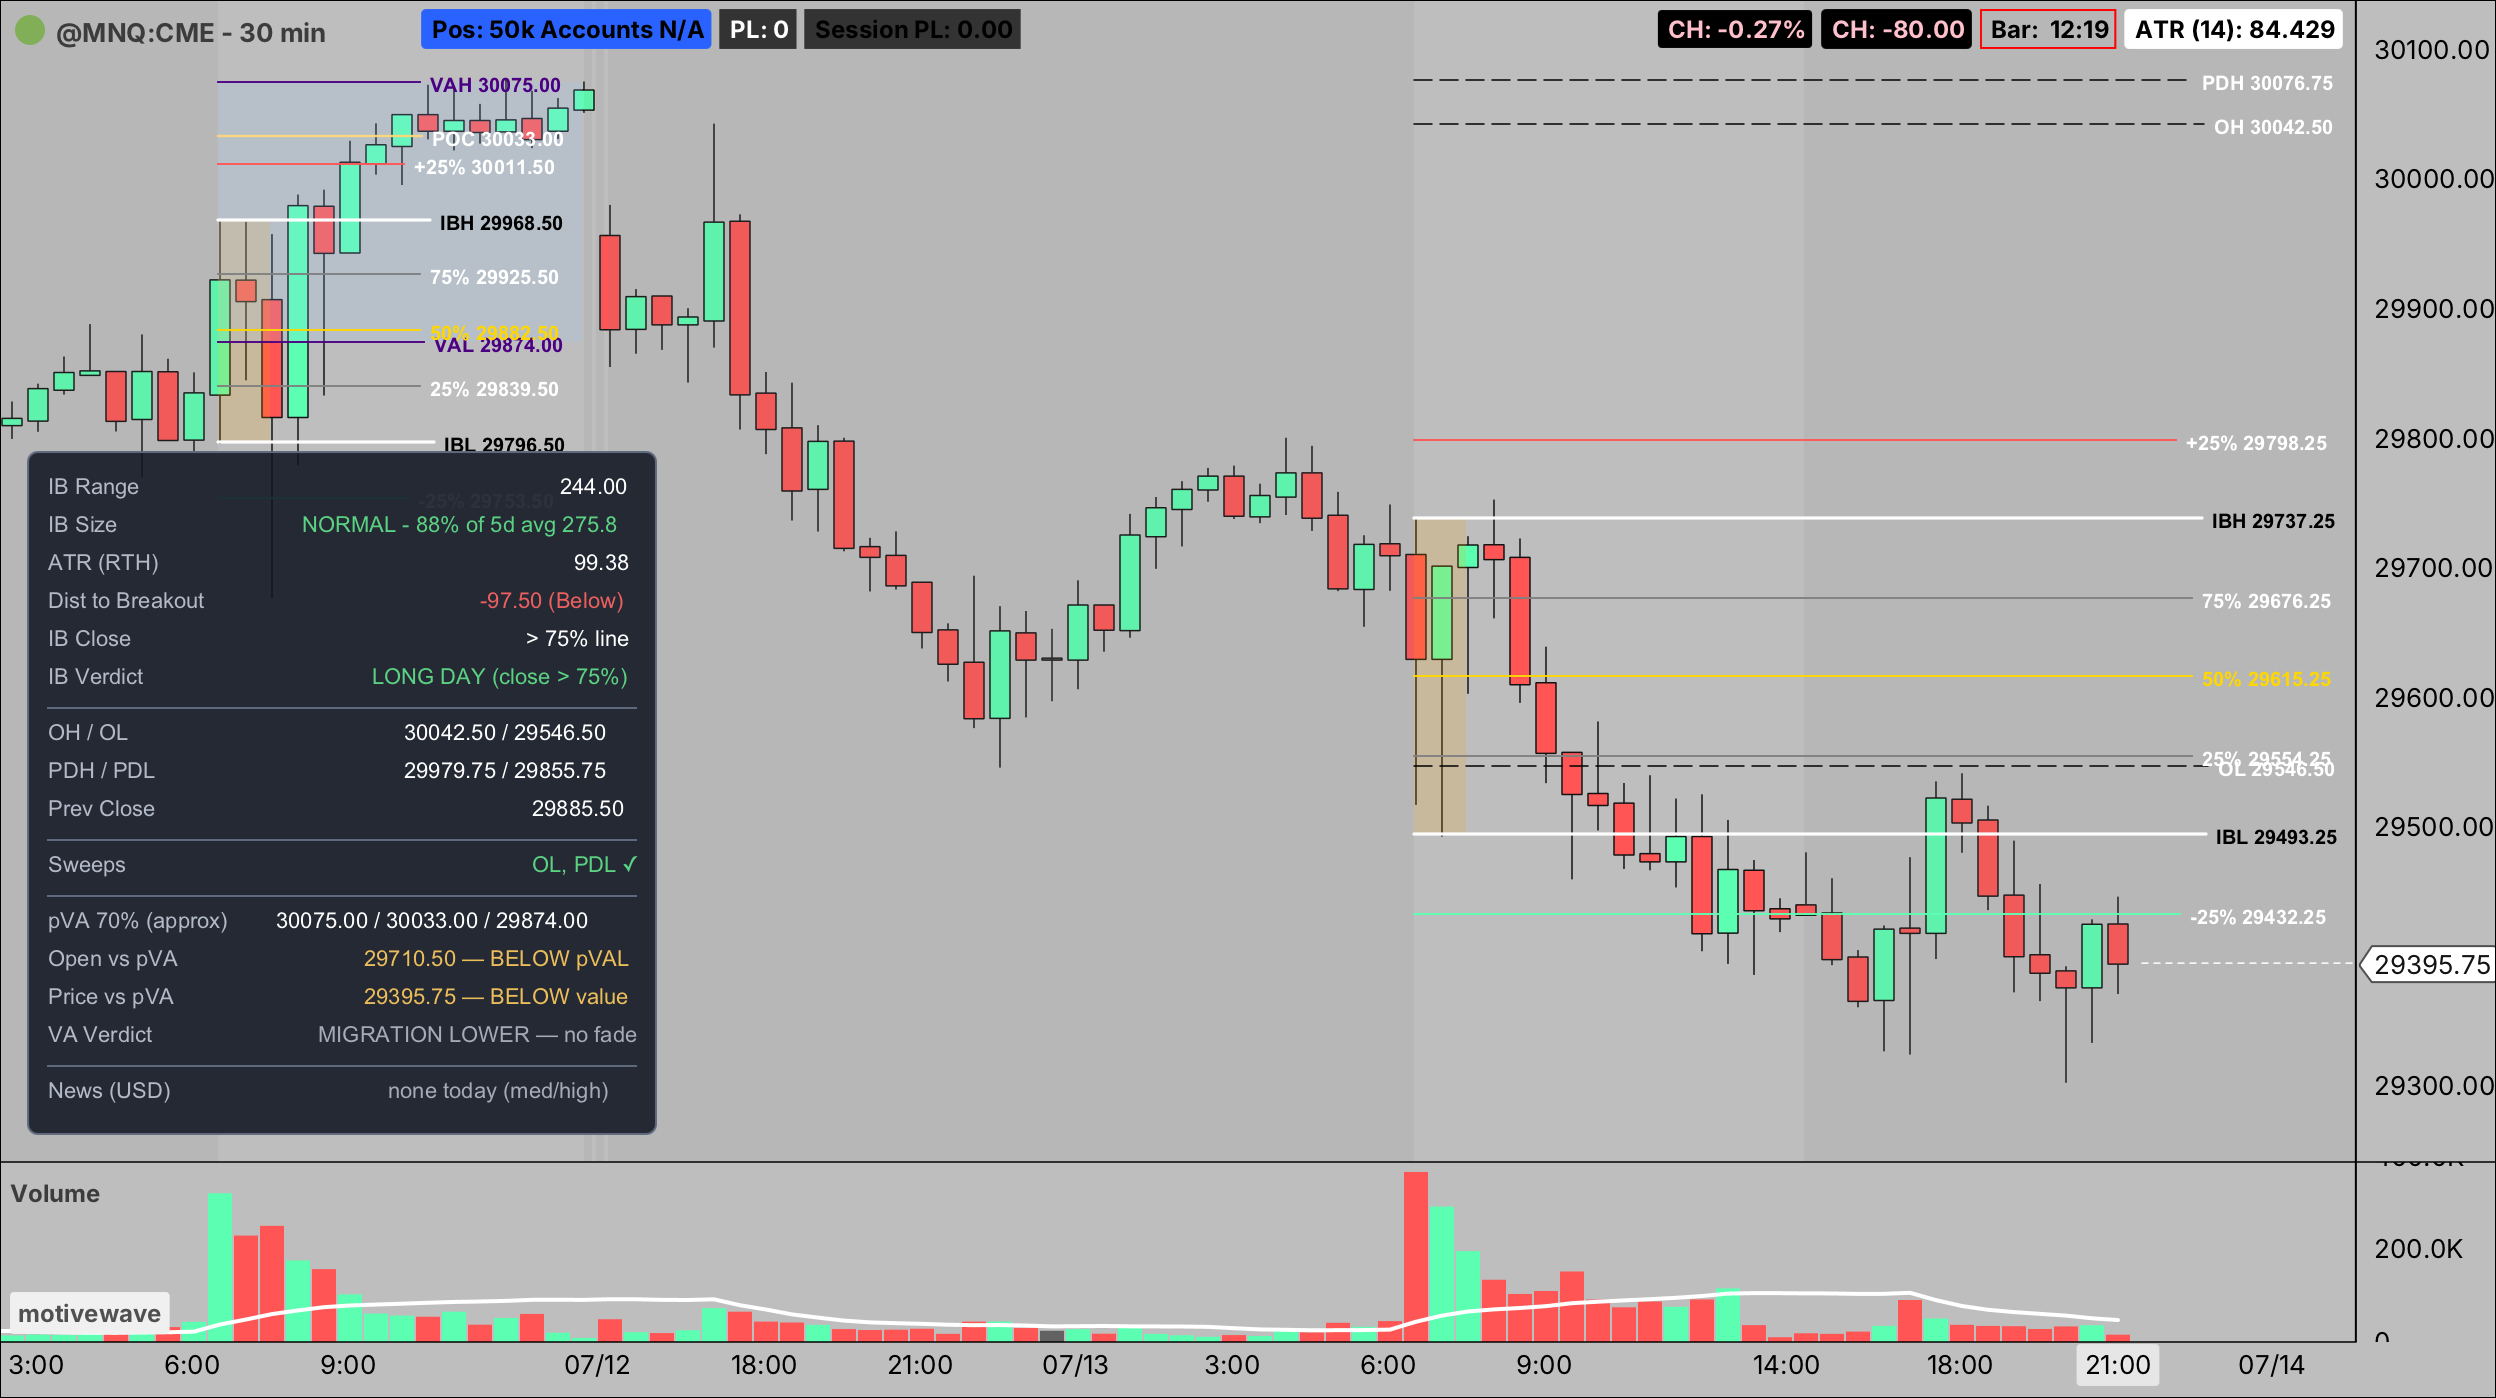
The read: short bias, sell rallies into the IB levels (the IB low at 29493 and the quartiles above) as price migrated down, with the "no fade" verdict keeping you out of every tempting bounce.
What played out: straight down. It broke roughly 97 points below the IB, swept the overnight low and prior-day low (Sweeps: OL, PDL), and worked down to ~29395 — better than 300 points below where it opened.
MES — a balanced open that broke
MES was the trickier one — the kind of day that traps people. It opened at 7595.50, INSIDE prior value. Balanced. Early on, with a LONG DAY verdict and an inside-value open, the lean is a range/fade day, maybe even a long — nothing screaming "short."
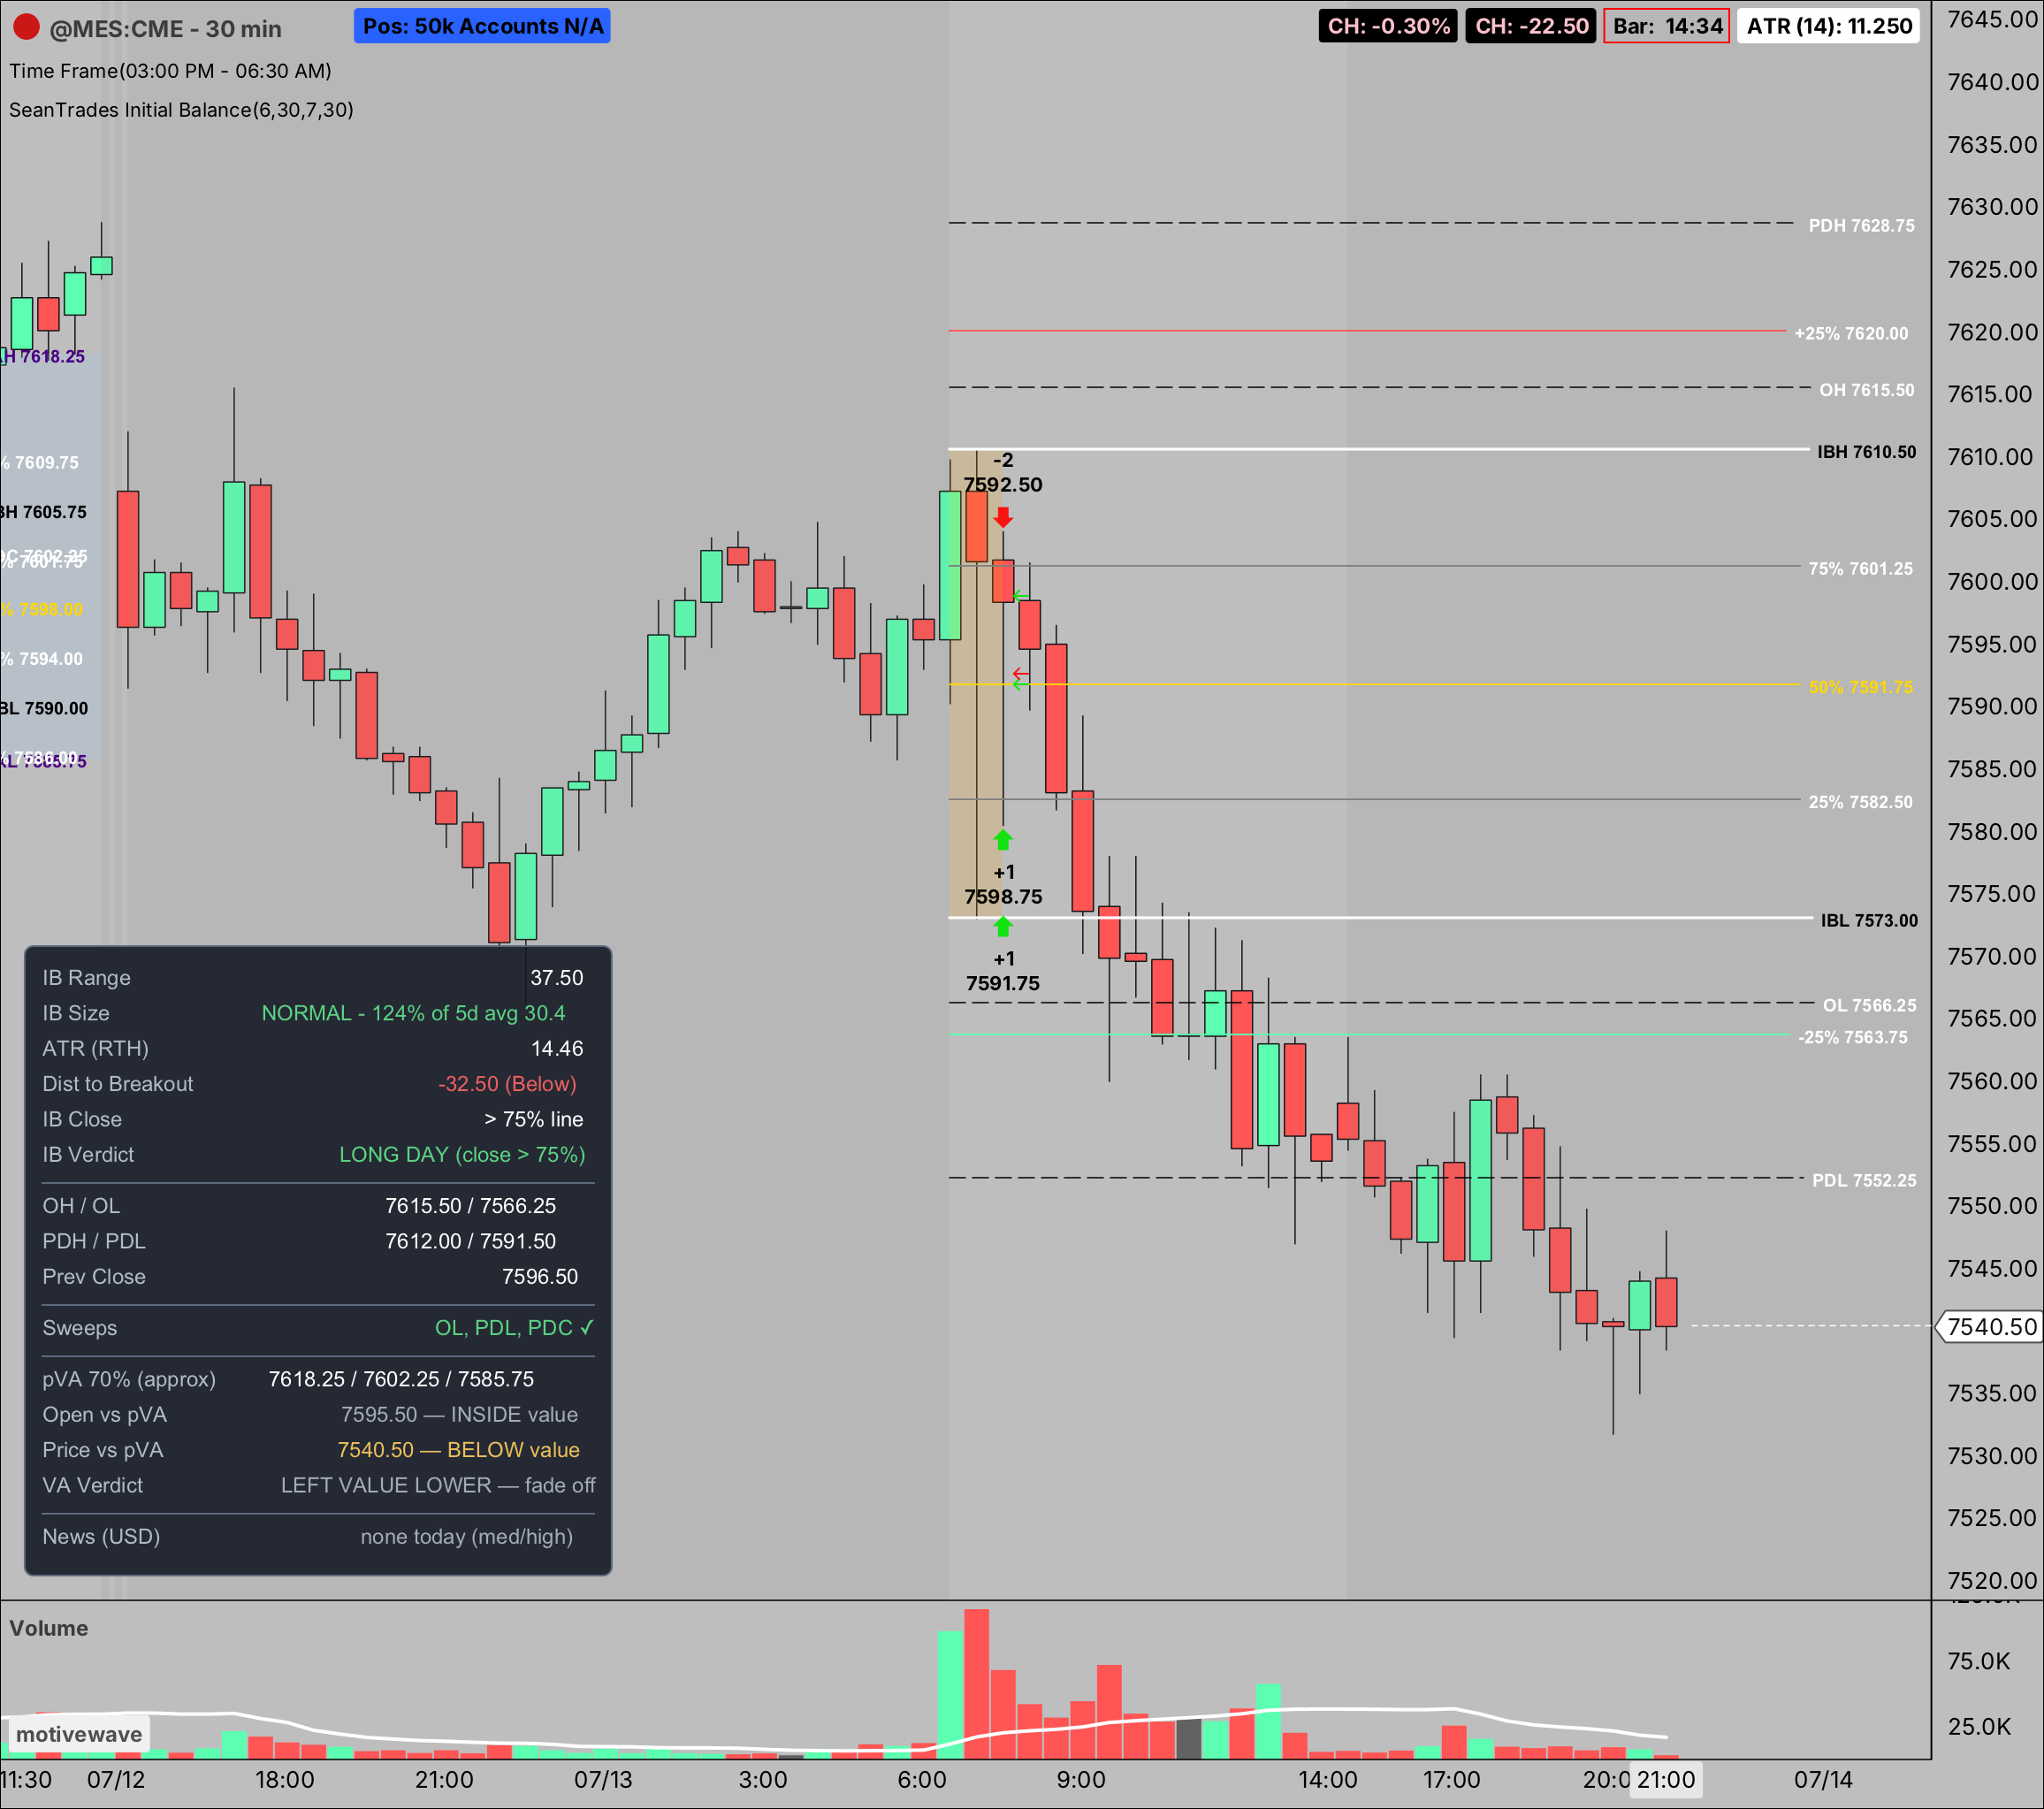
The tell came when price broke down out of the IB and the VA Verdict flipped to LEFT VALUE LOWER — fade off. That's the study catching the shift live: the balanced read is dead, value has left to the downside, drop the fade. That flip was the cue to stop thinking range and start thinking short.
The read: once value left lower and the IB broke, sell the breakdown and any retest back up into the IB, targeting the liquidity below.
What played out: it slid from the low-7600s down to ~7540, sweeping the overnight low, prior-day low, and prior close (Sweeps: OL, PDL, PDC) on the way.
The takeaway
Same net result — both were shorts — but two different tells. MNQ told you at the open (opened below value, migration lower, no fade). MES made you wait for the flip (balanced open, then LEFT VALUE LOWER — fade off once it broke). Both times the LONG DAY verdict was the trap, and the value-area read was the tell. That's the whole reason I lean on the VA Verdict — it updates as the day develops instead of freezing at the open.
The levels tell you where, the verdicts tell you what — but only your plan tells you whether.
For the record: this is me breaking down how I read two charts for educational purposes — it is not financial advice, not a trade recommendation, and not a result I'm claiming. The levels and verdicts are context for my own decisions. Futures carry substantial risk of loss — trade your own plan.