I finally packaged up the study I've been running on my own charts every day and put it out for free. It's called SeanTrades Initial Balance, and it's basically my whole session-prep routine turned into one MotiveWave study — every level I care about drawn automatically, plus a live read-out pinned in the corner. No more hand-drawing the same lines each morning.
It's built for 30-minute intraday futures charts (MES, MNQ, ES, NQ), but it'll run on any instrument and timeframe. Every level, row, and color toggles on and off, so you can strip it down to just the pieces you actually use.
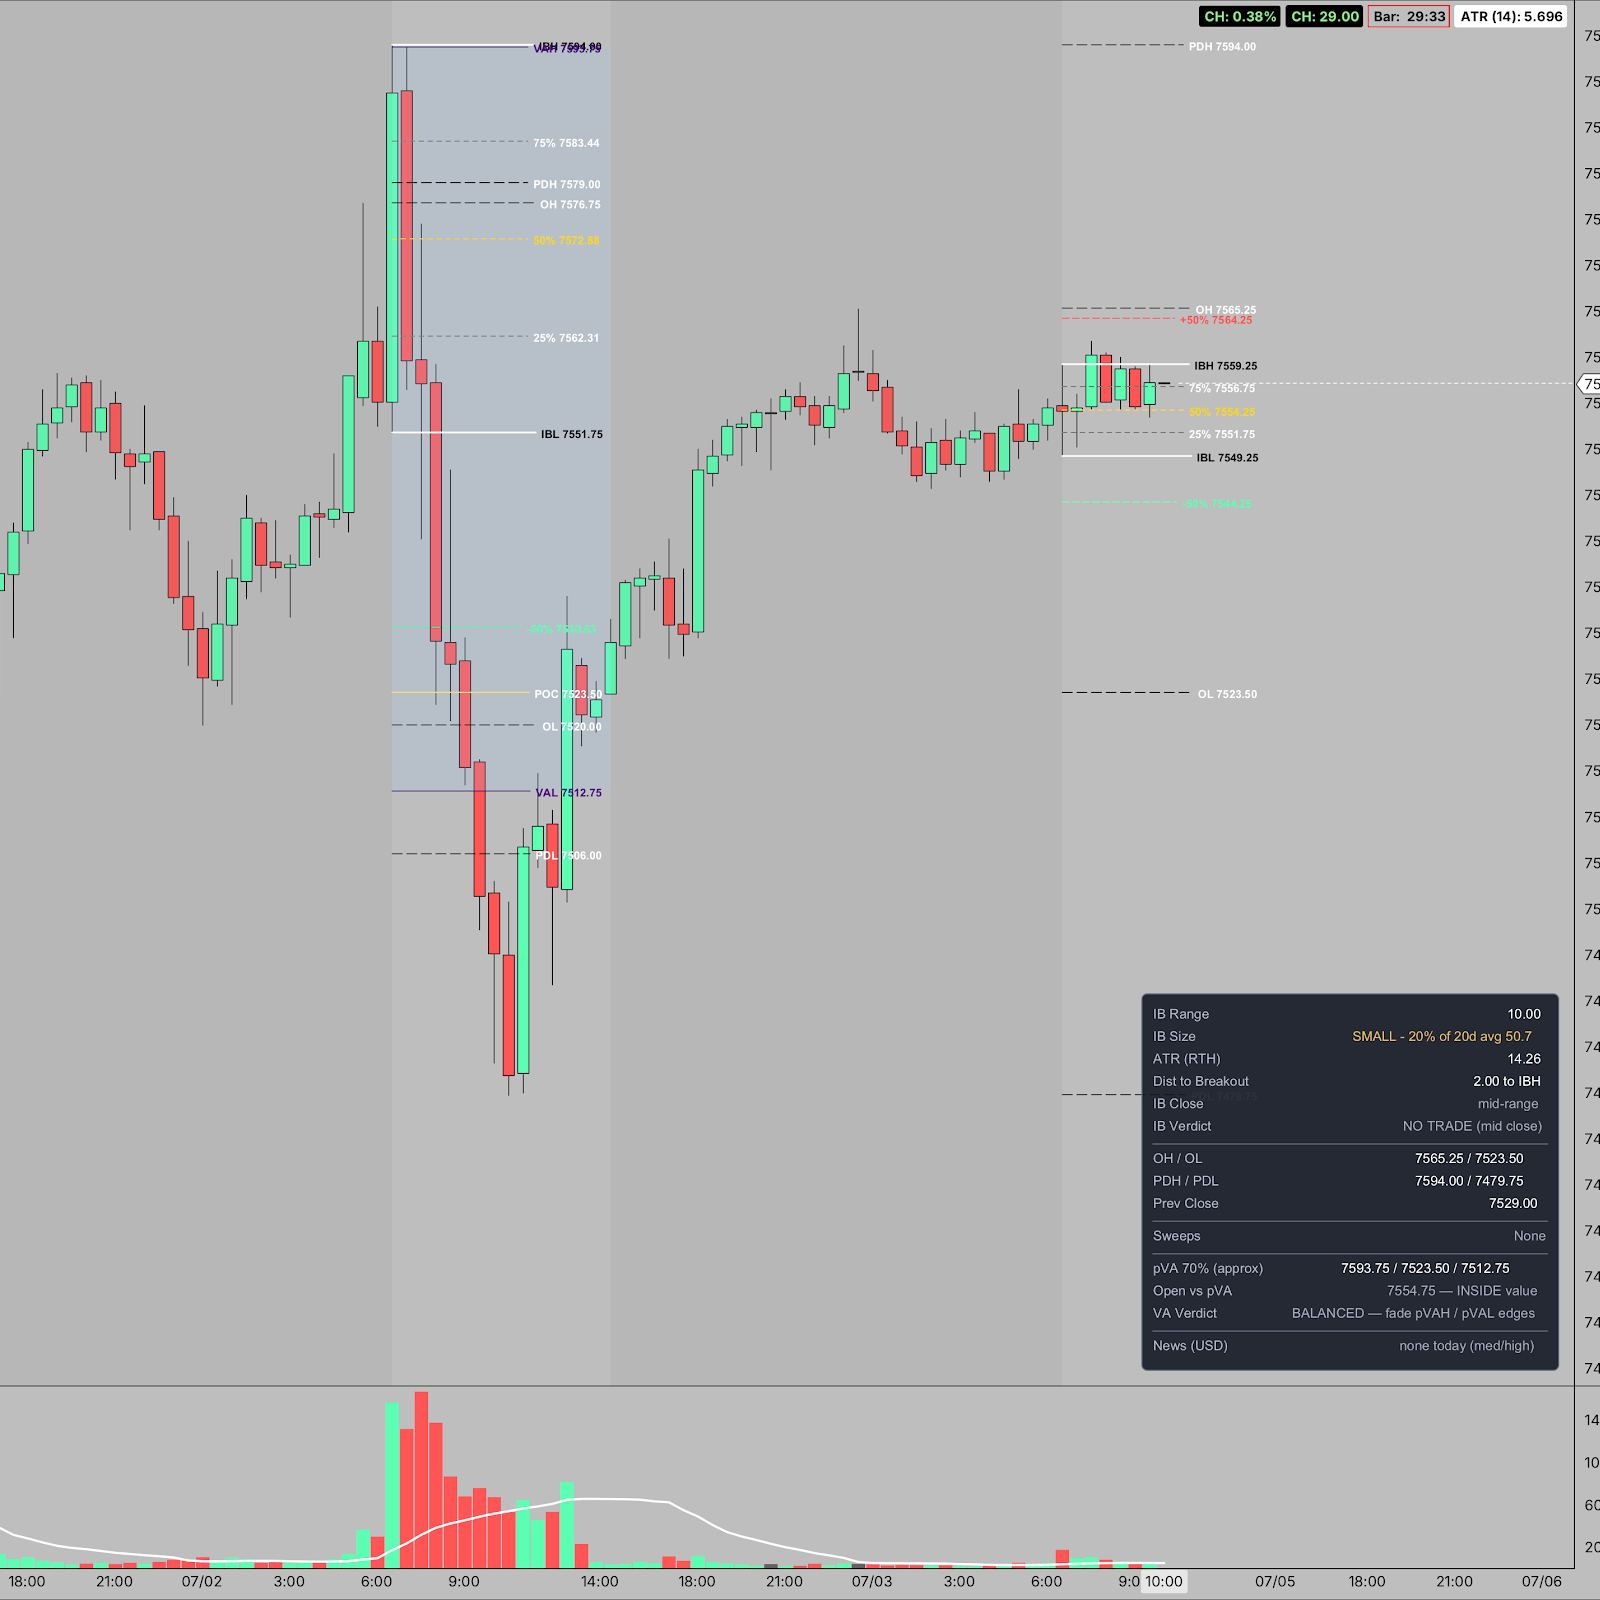
What it draws on your chart
- Initial Balance — the high and low of the opening window (default 9:30–10:30 ET, fully configurable), with the internal 25% / 50% / 75% splits and up to five range extensions for when price leaves the box.
- Overnight high / low and previous day high / low / close — the reference levels that tend to matter most.
- A computed value area for the session — VAH, POC and VAL, with optional shading. Run it regular-hours-only or include overnight, and you can even project yesterday's value area across today.
The live table is where it earns its keep
The corner table is the part I lean on. Every row toggles independently — here's what stays on for me:
- IB Range & IB Size — the opening hour's range, and the part I use most: whether that range is SMALL, NORMAL or BIG versus the last ~20 sessions. It recalibrates automatically when I switch contracts.
- ATR (RTH) — a clean Wilder ATR from regular-hours bars only, so thin overnight candles don't skew it.
- Dist to Breakout — live distance from price to the IB edge.
- Sweeps — which levels the open ran (OH, OL, PDH, PDL, prior close). By default it only flags prior-day levels taken during the session, not overnight — so you see the liquidity grabbed on your watch.
- IB Verdict — where the opening range locked: LONG DAY, SHORT DAY, or NO TRADE.
- Value-area read — yesterday's value area, whether today opened inside / above / below it, and a plain-English VA Verdict.
- News (USD) — the day's medium and high-impact US events from ForexFactory, in your local time, so a release doesn't catch you mid-trade.
How I actually use it to frame a trade
None of this is a signal — it's context, assembled in the order I read it:
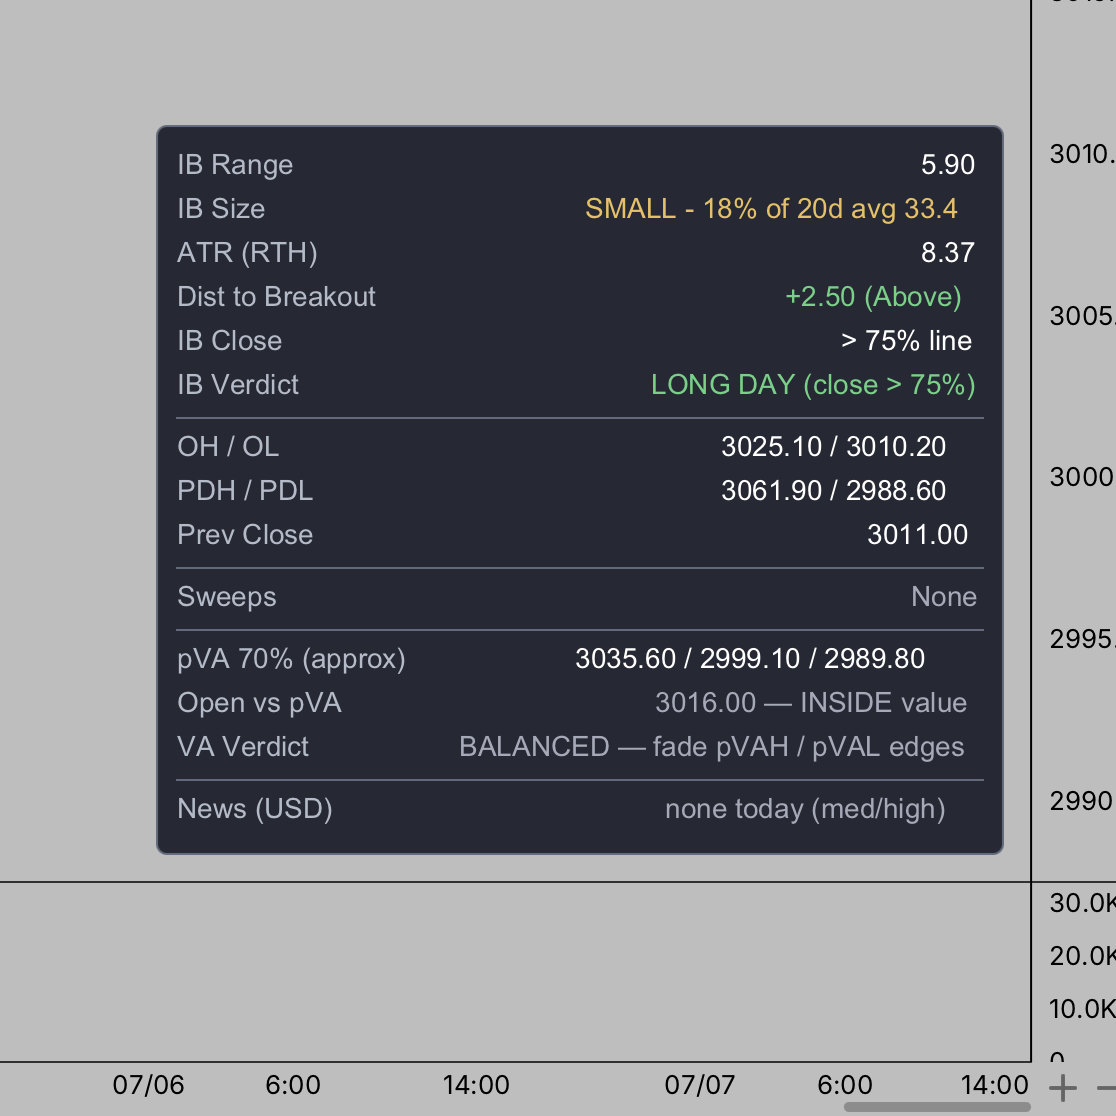
- IB Size first. A small opening range (like the 18–20% days in these shots) tells me the session came in quiet — I think very differently about a breakout than I would on a big-range day.
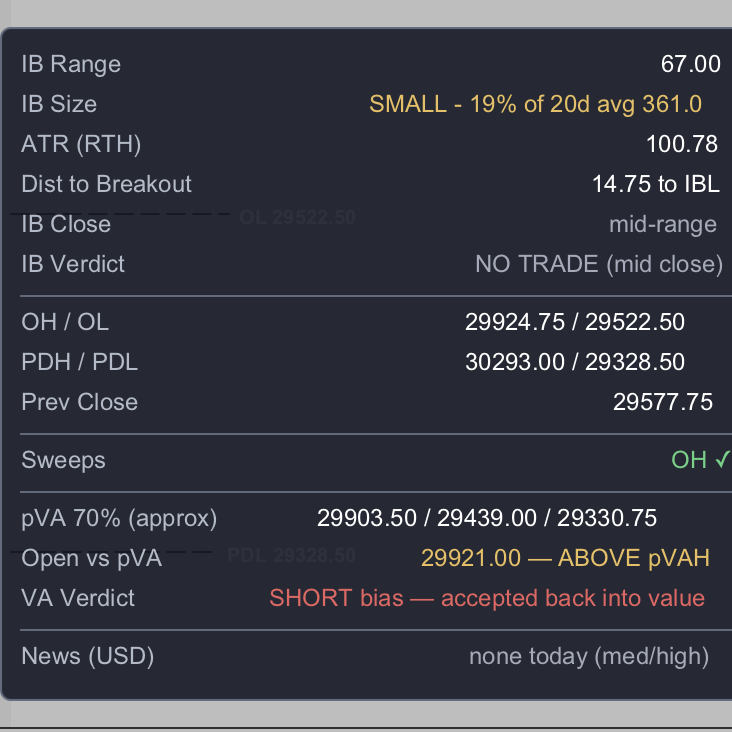
- Where did we open versus value? Open inside yesterday's value area and the day leans balanced — I'm watching the edges to fade. Open outside value and then get accepted back in, and the lean flips toward a move back through value.
- What got swept? If the open already ran the overnight high or a prior-day level, that liquidity is gone — it changes what I trust.
- News check. If there's a high-impact print coming, I size and time around it.
Here's the table calling exactly that second scenario — price opened above value, got accepted back in, and the study flags a short bias:
The levels tell you where, the verdicts tell you what — but only your plan tells you whether.
From there the levels give me my structure: where to lean, where I'm wrong, and where I'm aiming. The actual trade still comes from my own plan.
Get it — it's free
The study is completely free to download and share. Grab it from my Ko-Fi, drop the .jar in your MotiveWave Extensions folder, and add it from the Study menu (full install steps are in the included README). If it earns a spot on your charts and you want to chip in toward future features, that's appreciated — but never required.
A couple of setup notes: it works on MotiveWave, and for the overnight and value-area rows your chart needs extended / overnight data enabled. Give it ~25 sessions of history so the IB Size average can build, and allow MotiveWave internet access for the news row.
For the record: this is an informational tool for educational purposes, not financial advice. The verdicts are inputs to your decision, not calls. Futures carry substantial risk of loss — trade your own plan.