Third one this week, and it might be my favorite. It's called Stretch, and it does something the others don't: it turns "price looks extended" from a gut feeling into an actual number. Underneath it's a moving-average band with an optional session VWAP — but the real work happens in a live table that tells you, at a glance, when price is stretched further from your averages than it normally gets.
What's on the chart
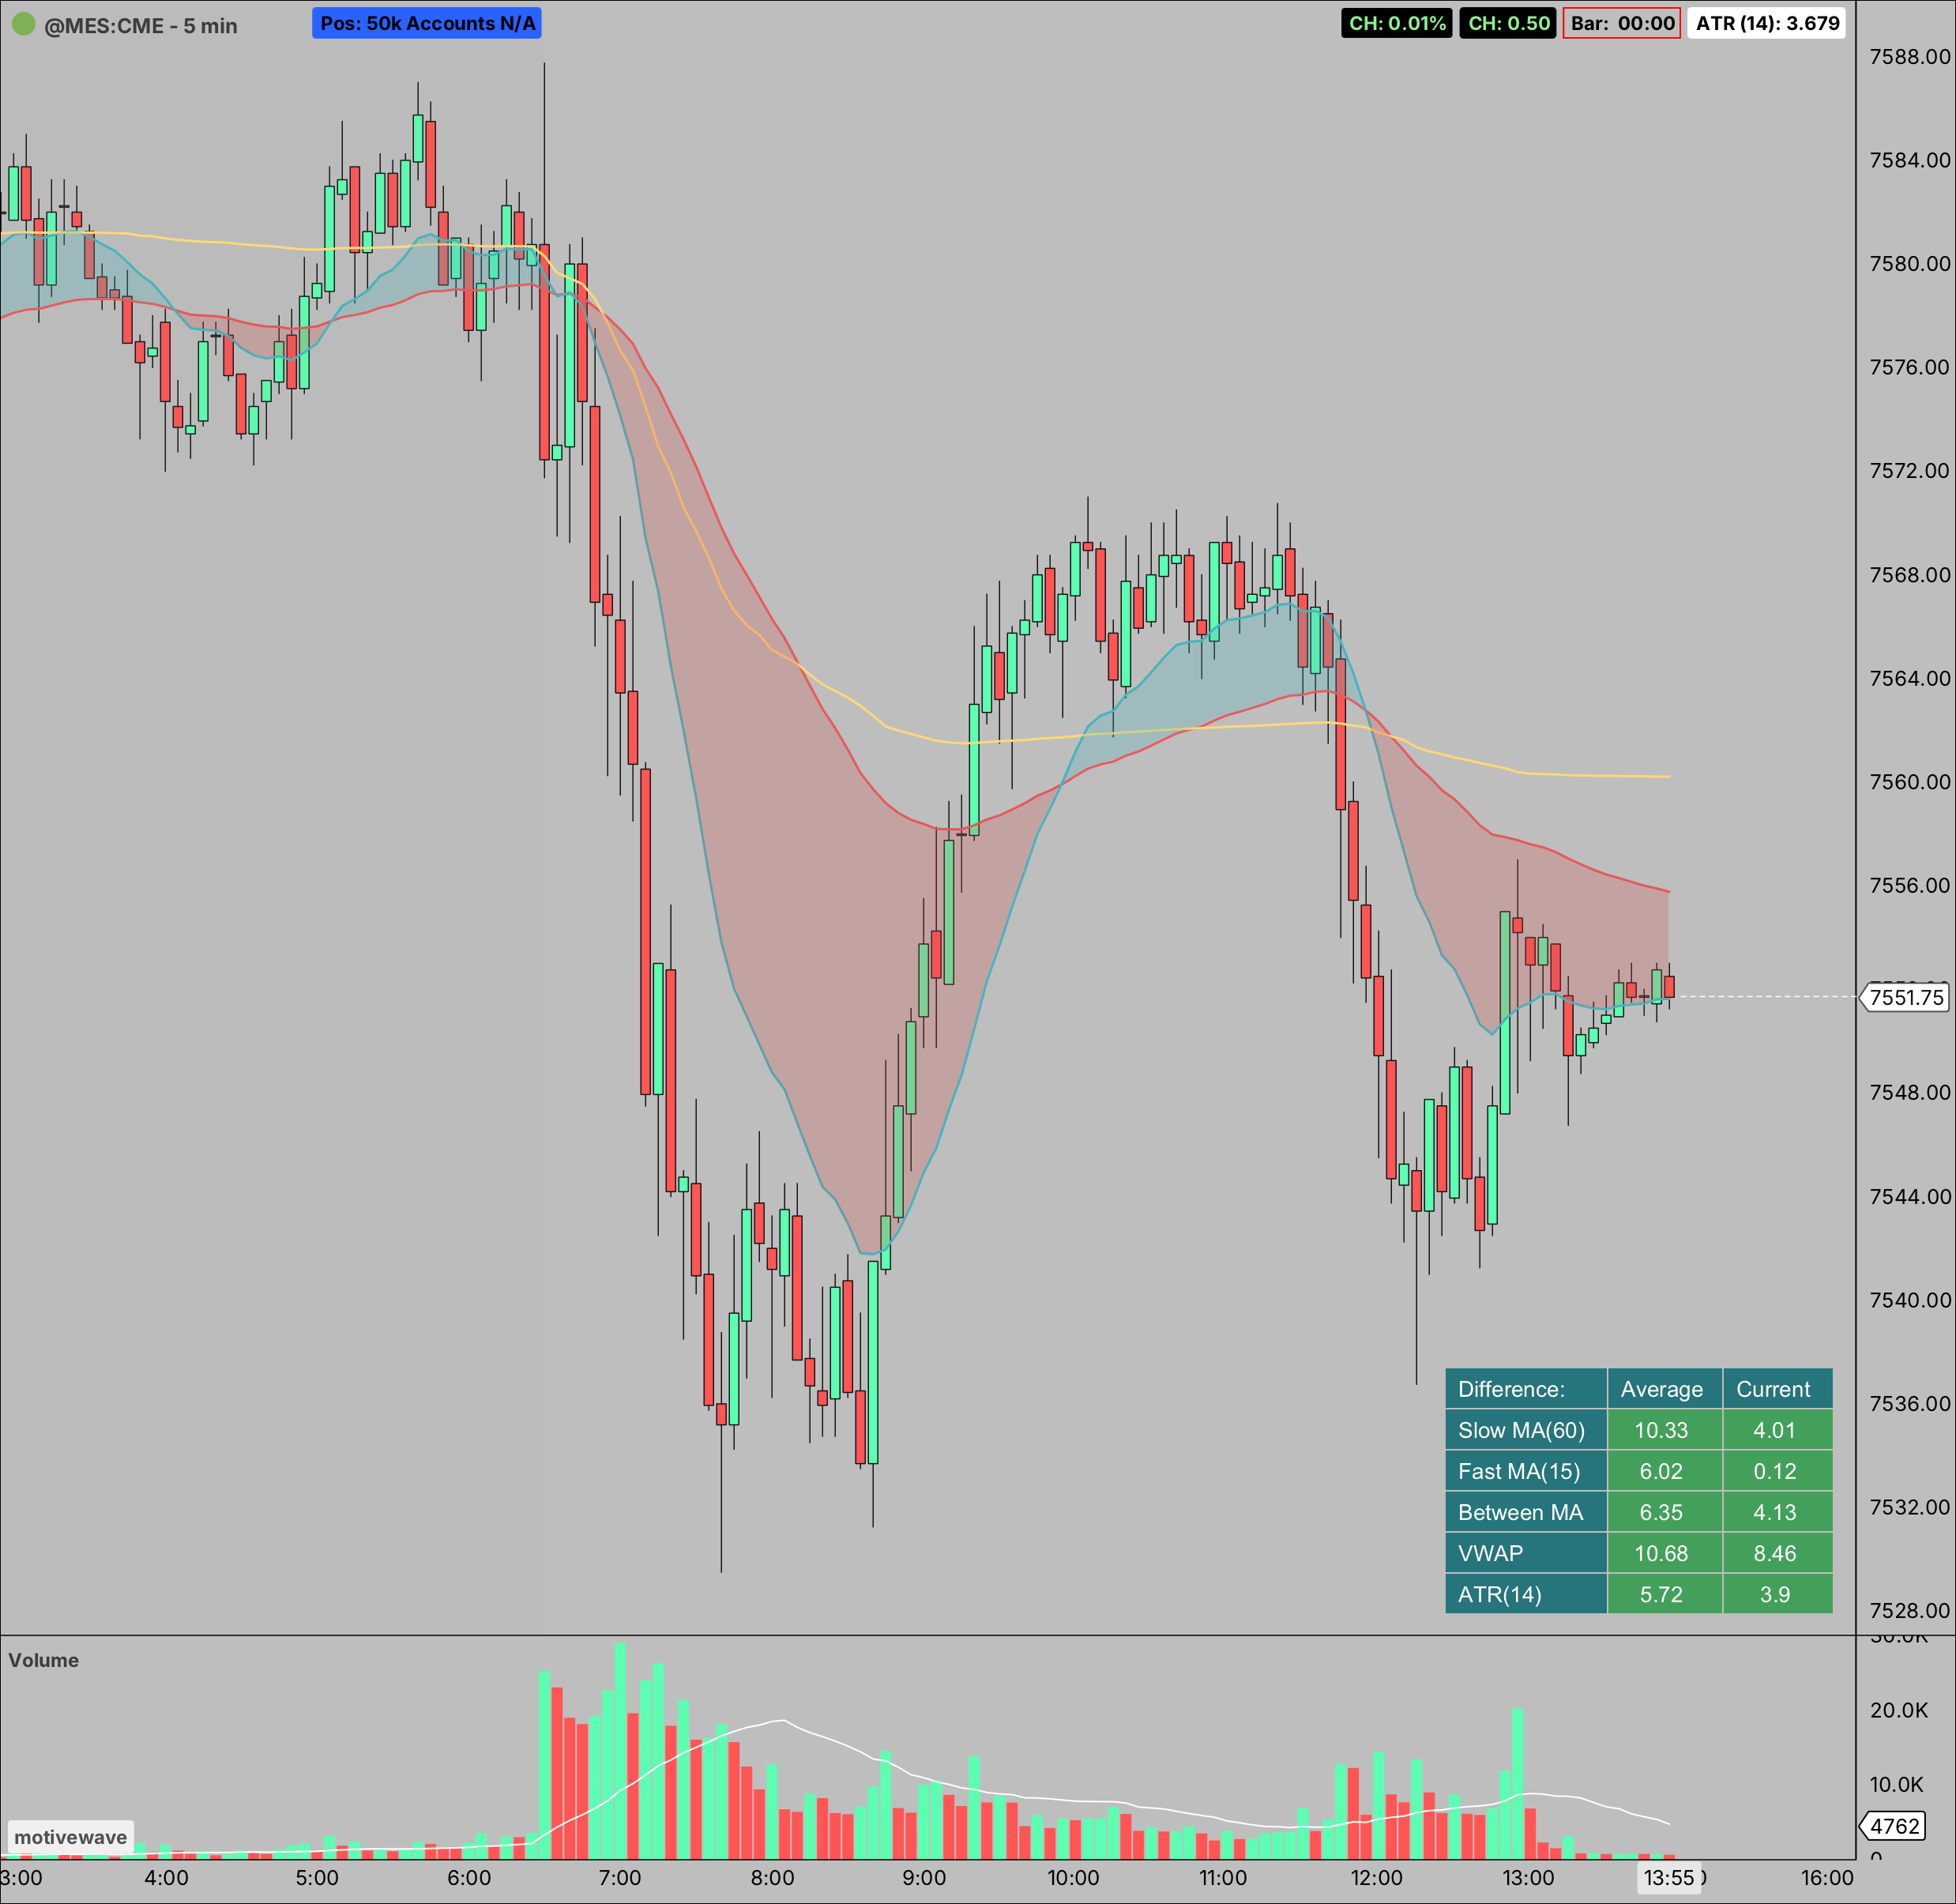
Two moving averages — a fast one and a slow one — with the space between them shaded. The fill is green when the fast MA is above the slow (bullish) and red when it's below (bearish), and it flips cleanly right at each crossover instead of smearing across the bar. On top of that you can switch on a session-anchored VWAP with 1, 2, or a custom standard-deviation band — tagging the 2 SD band is the classic "stretched, watch for a snap-back" condition.
The table is the whole point
The band is really just the backdrop. The table is what I built this for. For each line — the slow MA, the fast MA, the spread between them, VWAP, and ATR — it shows two numbers: how far price normally sits from that line (Average), and how far it's sitting right now (Current).
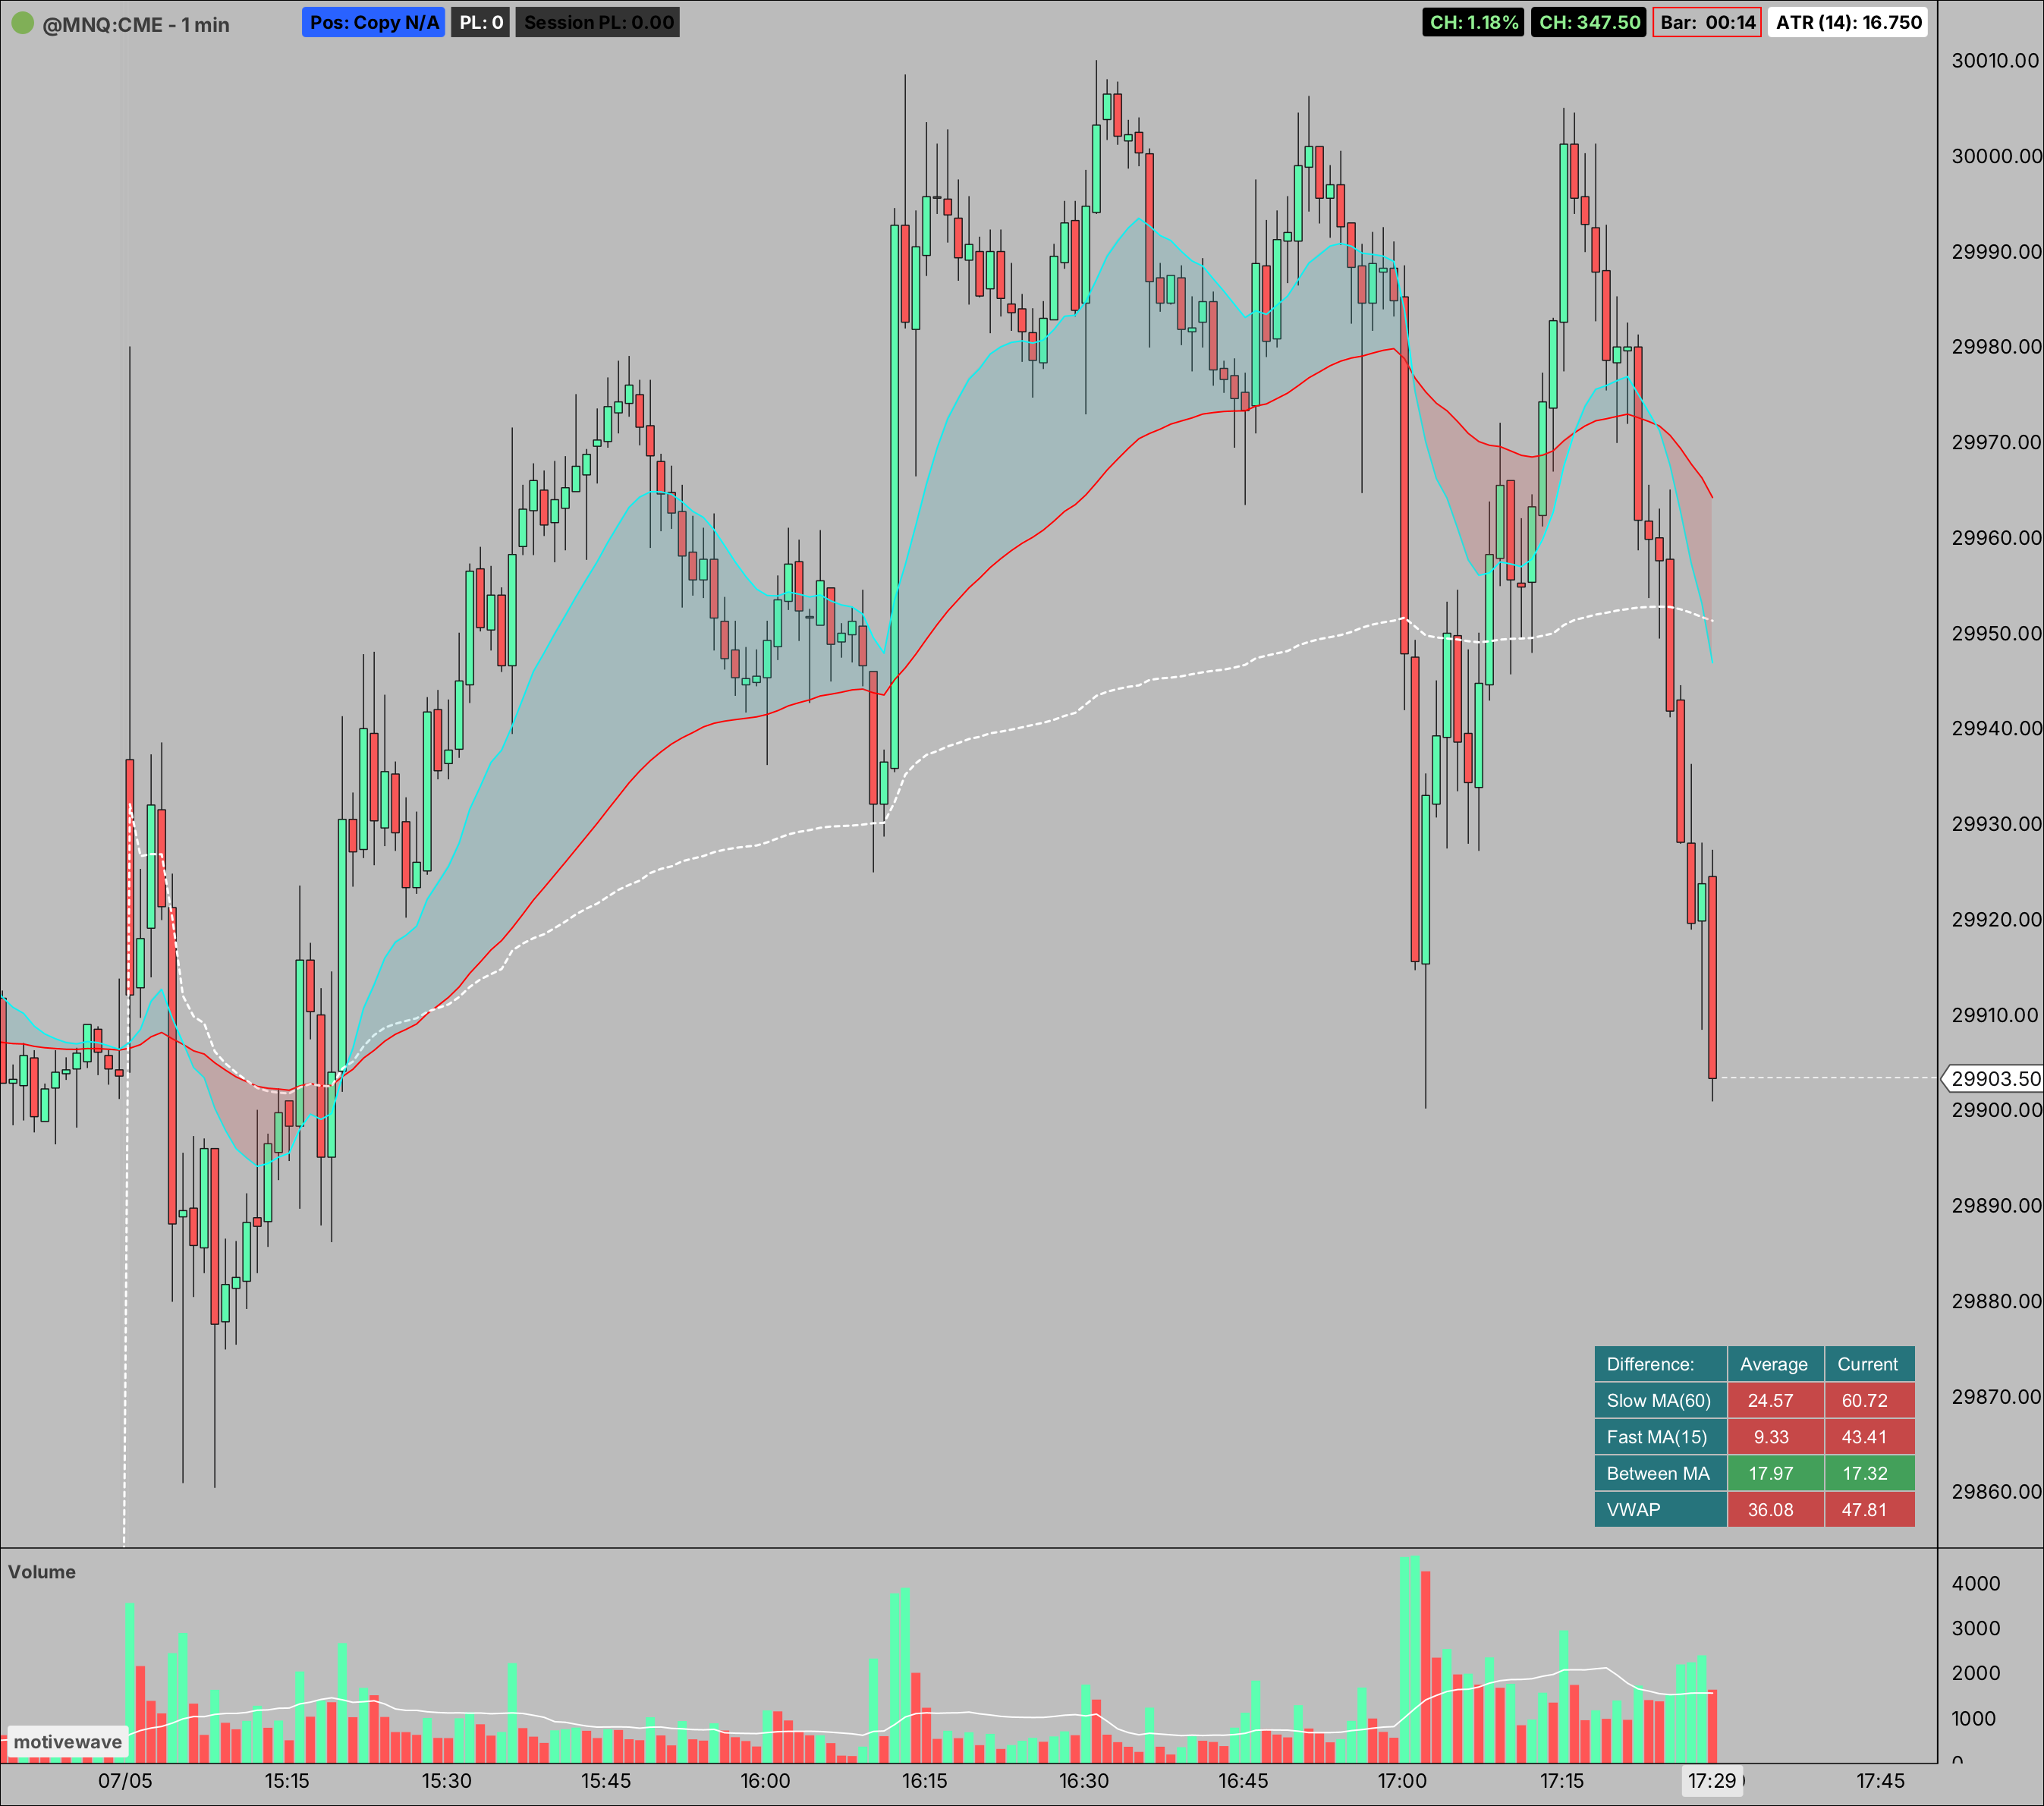
Every cell stays green while Current is at or below its Average, and turns red the moment Current pushes past it. Red means price is stretched beyond its normal range — measured, not eyeballed.
How I read it
- All green, price near the band → balance. Price is where it belongs; little edge for a reversion play.
- One or two rows red → price is stretching from the faster references first. Early extension, worth watching.
- Every row red at once, including Between MA → price is far from all my references and the MAs have spread wide. That's the full-extension read — where a snap back toward the mean most often sets up. I pair it with the VWAP 2 SD band and my own confirmation (a rejection wick, a level) so it's a framed idea, not a blind fade.
- A row flipping back to green → the gap is closing; price is already reverting toward the line.
One thing I keep front of mind: red means "stretched," not "sell." A strong trend will stay red for a long time as it runs. The table tells me price is at an extreme — my plan tells me whether that extreme is exhaustion to fade or momentum to respect. (Handy bonus: the ATR row's Current value doubles as an ATR-based stop size, in points.)
The band tells you the trend, the table tells you the stretch — but only your plan tells you whether.
Get it — it's free
Free to download from my Ko-Fi, and it works on any instrument and timeframe. Drop the .jar in your MotiveWave Extensions folder and add it from the Study menu (full steps are in the included README). If it earns a spot on your charts and you want to chip in toward future features, that's appreciated — but never required.
Setup notes: it works on MotiveWave. For the regular-hours VWAP anchor and clean session gaps, your chart needs extended / overnight data available, and load enough history to fill the lookback window so the Average column is meaningful.
For the record: this is an informational tool for educational purposes, not financial advice. The band, bands, and table are context for your own decisions, not calls. Futures carry substantial risk of loss — trade your own plan.