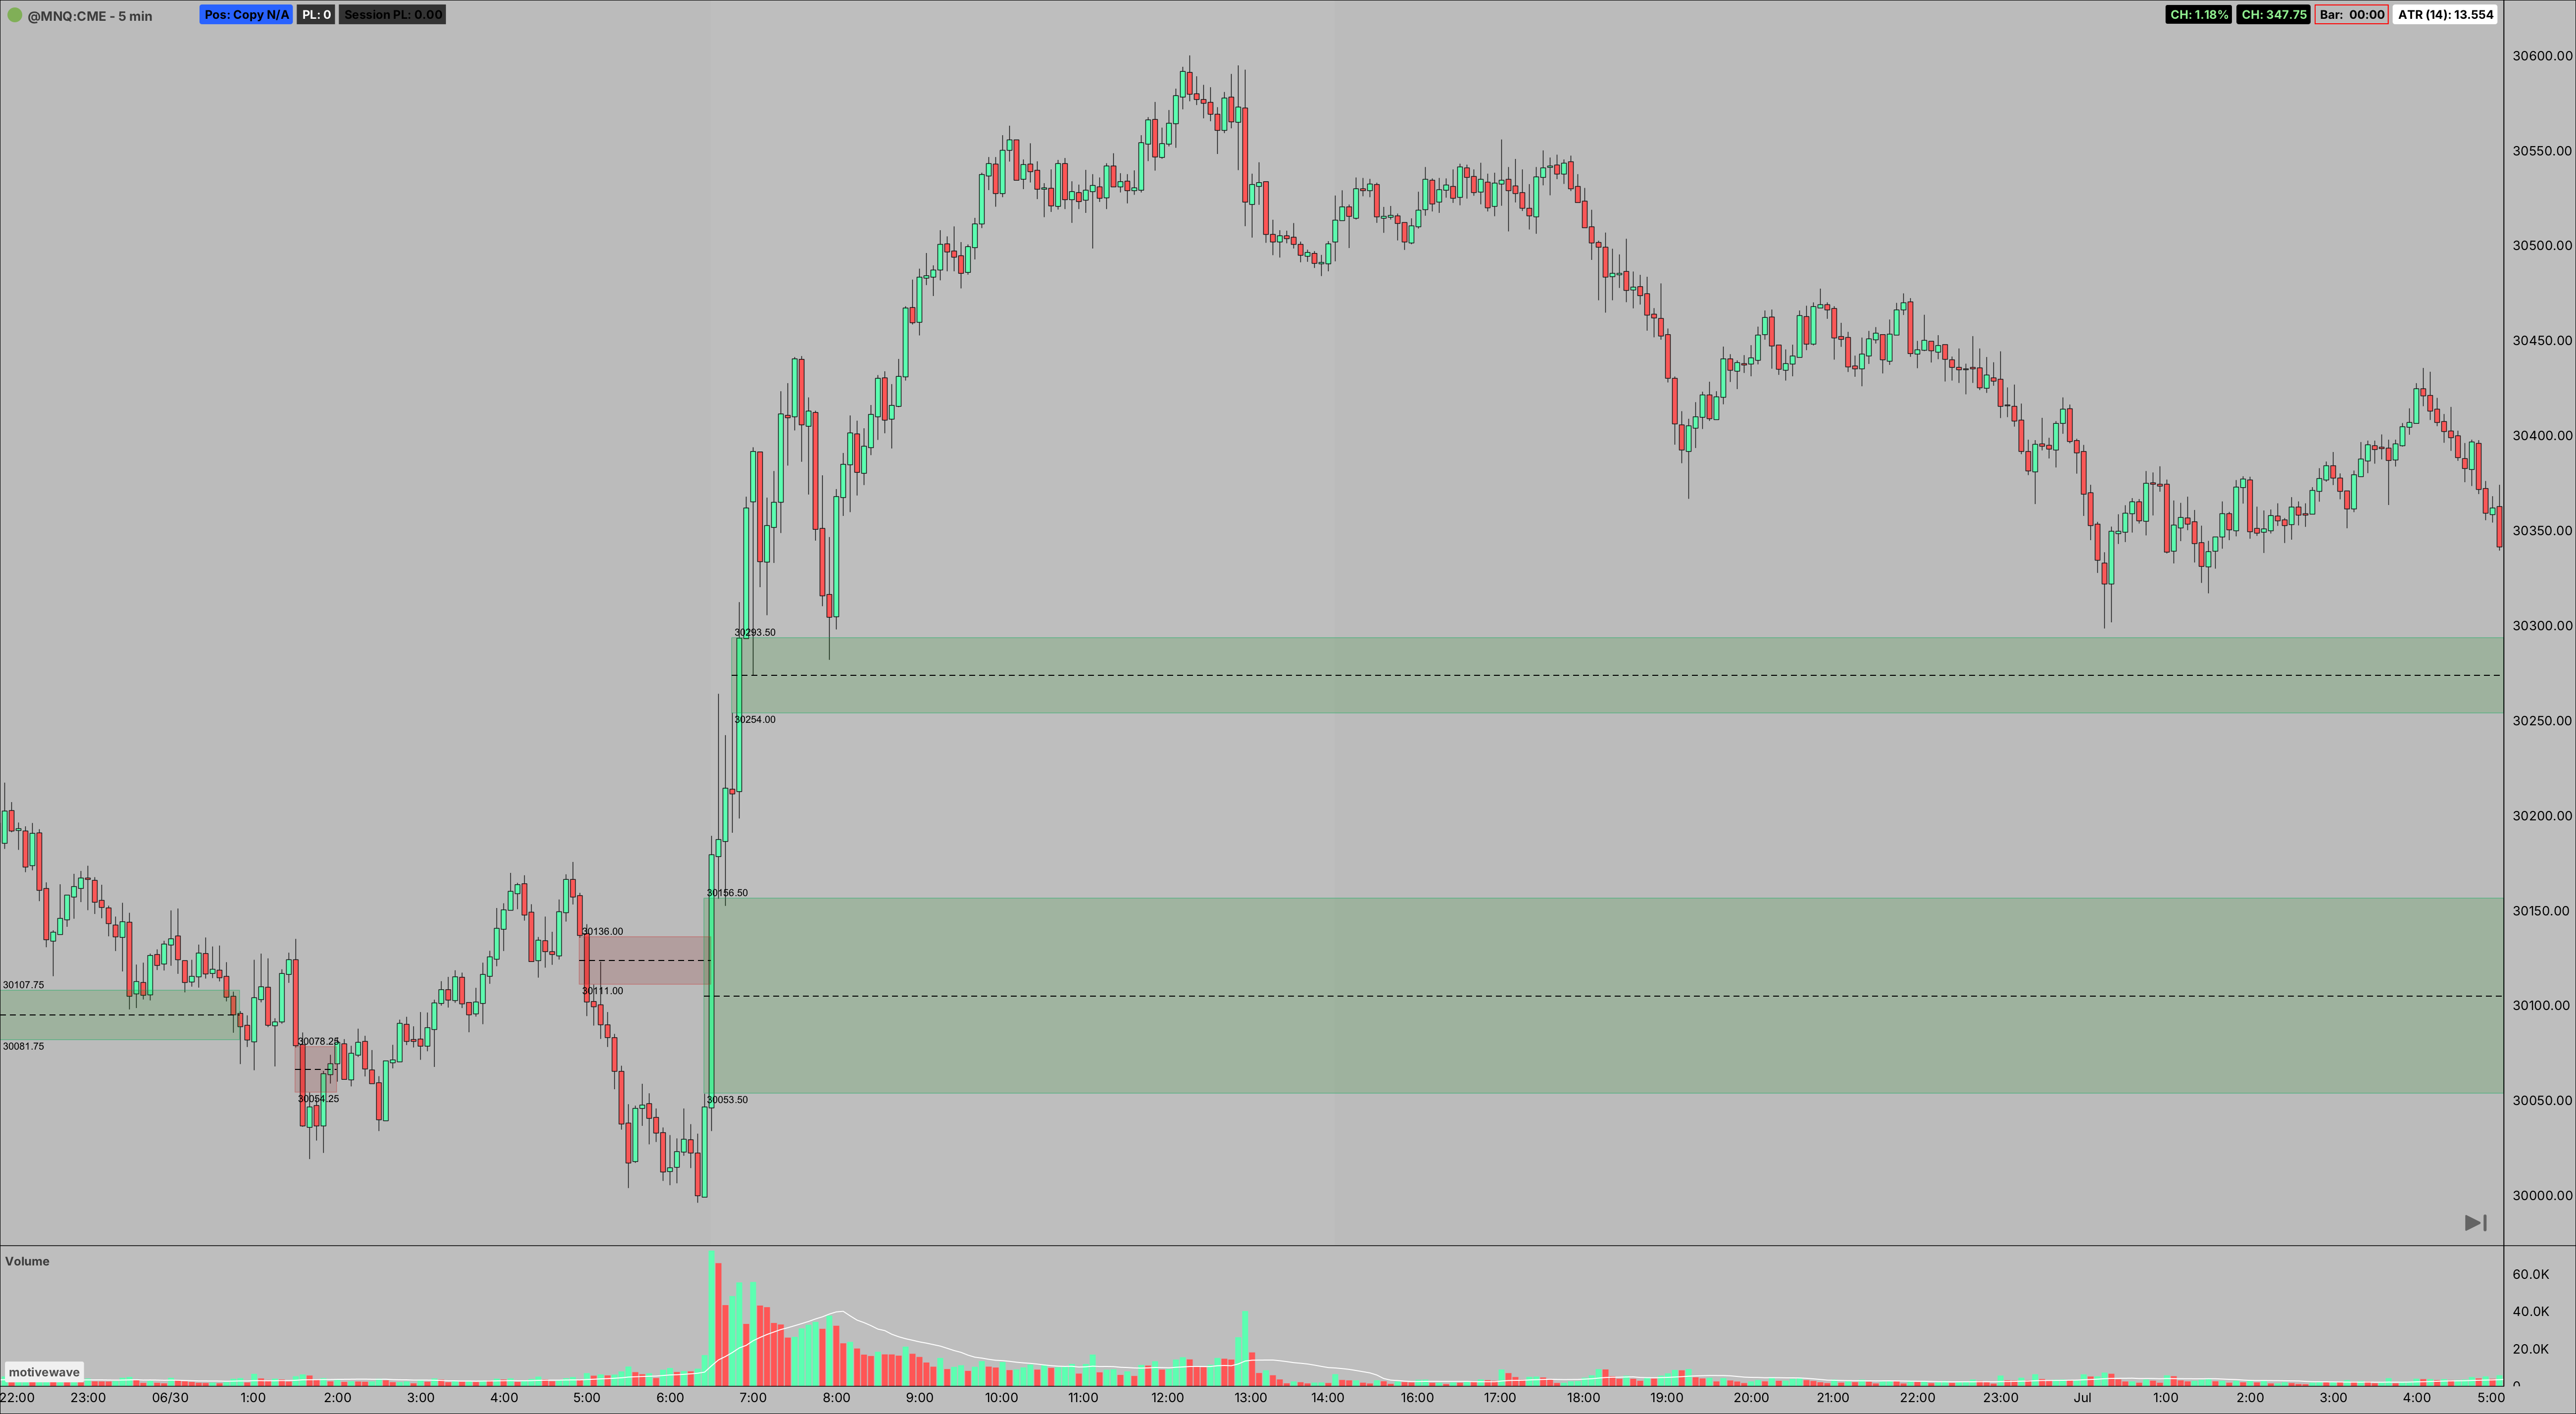
New one out today. It's a MotiveWave study that automatically marks ICT Fair Value Gaps on your chart — but with a twist that fixes my biggest gripe with every other FVG tool: it only draws the gaps that formed on a real surge of volume.
Quick refresher: what's a Fair Value Gap?
An FVG is a three-candle imbalance — a spot where price moved so fast it left a little untraded gap behind. A bullish gap is when the third candle's low sits above the first candle's high; a bearish gap is the mirror image. Traders watch these gaps as areas price often revisits.
The one filter that matters
Here's the thing: most FVG tools paint every gap on your chart, and honestly most of them are noise. This study adds a single filter that changes the whole picture — the candle that creates the gap has to trade on above-average volume. If a gap forms on a quiet, below-average bar, it gets ignored. Only gaps built on real participation make it onto the chart.
That's the displacement idea: a gap carved out on heavy volume reflects real money moving, and it's far more likely to matter as a level later. And because the threshold is a rolling average, "2x volume" means 2x whatever is normal right now — so it adapts on its own between a sleepy overnight session and a busy cash open, on any market.
What you can tune
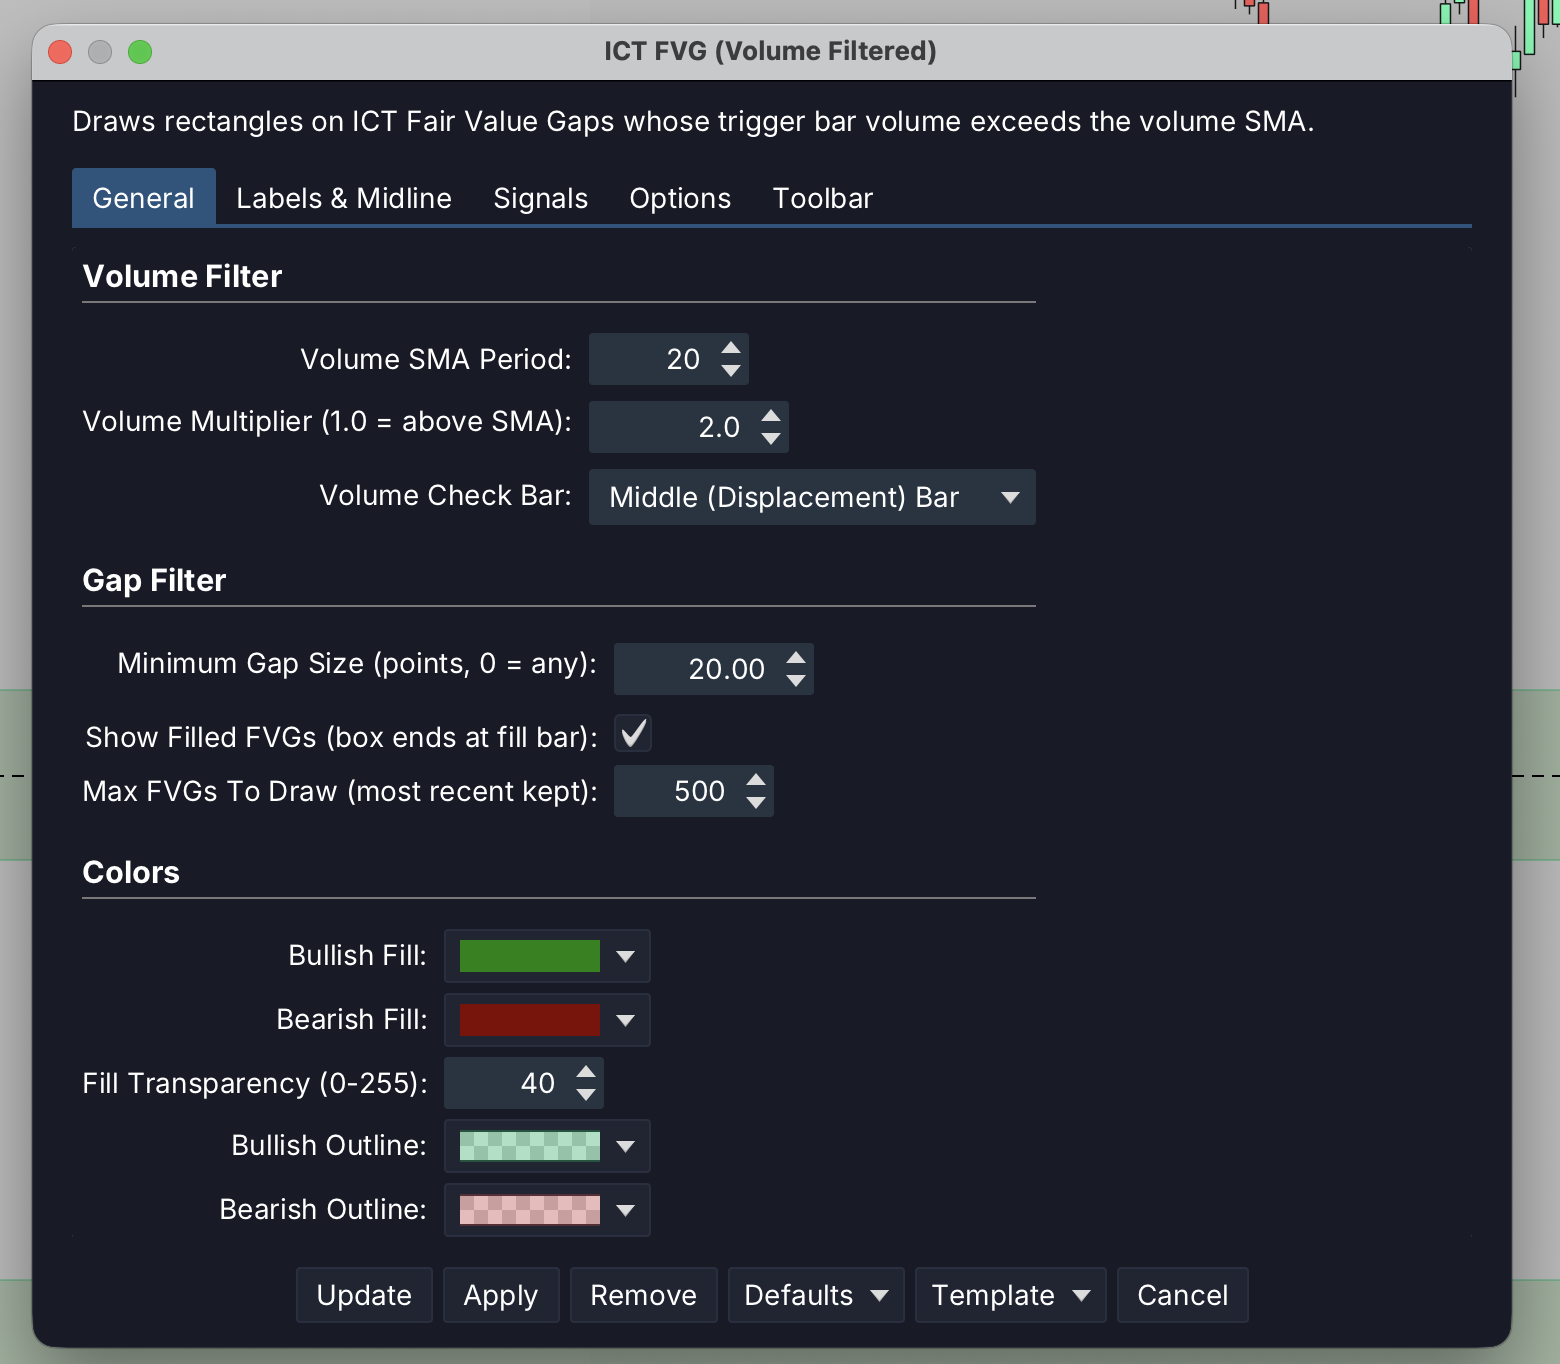
- Volume multiplier — start at 1.0 to see every above-average gap, then raise it toward 2x+ to keep only the strongest displacement.
- Which candle is tested — first, middle (the displacement bar), or any of the three.
- Minimum gap size — skip tiny one- or two-tick gaps on low timeframes.
- 50% line — an optional midpoint line on every gap ("consequent encroachment"), the level a lot of traders watch for a reaction.
- Alerts — it fires a signal on every new qualified gap, so you can attach a sound, popup, or email and not babysit the chart.
Every color, label, and line is individually styleable, and once a gap gets fully traded back through, its box freezes at the fill bar so you can see it was filled.
How I use it to frame trades
On my charts it does two jobs. First, it de-clutters — I'm only looking at gaps with volume behind them, so the levels left standing are the ones with participation. Second, those volume-backed gaps become areas I care about: places price might revisit and react to, or that can act as support and resistance as a move develops. The 50% line gives me a finer read than just the edges.
The gap tells you where, the volume tells you whether anyone showed up — but only your plan tells you what to do about it.
None of it is a signal to buy or sell. It's context: cleaner levels, with a reason to trust them.
Get it — it's free
Free to download from my Ko-Fi. Drop the .jar in your MotiveWave Extensions folder and add it from the Study menu (full steps are in the included README). If it earns a spot on your charts and you want to chip in toward future features, that's appreciated — but never required.
Setup is simple: it works on MotiveWave and just needs volume data on your chart (every standard futures feed supplies it). To mark gaps from earlier sessions, load enough chart history for the days you want covered.
For the record: this is an informational tool for educational purposes, not financial advice. The gaps and lines are context for your own decisions, not calls. Futures carry substantial risk of loss — trade your own plan.