Passing a prop evaluation is not a profit problem. It's a survival problem. The account has a target you have to reach, sure — but the thing that actually ends 90% of attempts is the drawdown, not the target. So the right question isn't "what's the most profitable strategy." It's "what survives the rules."
So I took the IB breakout-retest scalp — a dead-simple, one-trade-a-day setup — ran it on ES and NQ together, and pointed the backtester's evaluation model at a standard 50K combine's actual constraints. On the data, it passed 93% of the time. Here's why it fits the job, and every reason to keep your guard up.
What a 50K eval actually asks of you
Strip a typical 50K combine down and it's three numbers:
- A profit target — around $3,000.
- A trailing drawdown — around $2,000. Draw down past it and you're done, balance be damned.
- A daily loss limit — around $2,000. Have one bad enough day and you're out.
Read those again and the game reframes itself: you need to grind out ~$3k without ever coughing up $2k. That's not a call to swing big — it's the opposite. The winning trait here is a small, boring drawdown. A strategy that makes less but never digs a hole beats a flashier one that risks blowing the buffer. That's the entire brief.
The setup, in one breath
- Mark the Initial Balance (first 60 min of the cash session).
- A confirmation bar closes beyond the IB → that arms a long (above) or short (below).
- Enter on the first retest, filled at the level.
- Fixed target, wider fixed stop. One trade per instrument per day, flat by midday.
I didn't run identical settings on both — each market gets tuned to its own personality:
- ES — a quick 3-minute confirmation close beyond the IB, then a 3-point target against a 10-point stop.
- NQ — faster and noisier, so it waits for a stricter 15-minute close beyond the IB before arming (a more committed breakout that filters out the chop), then aims for a 10-point target against a 40-point stop to give the bigger instrument room to breathe.
Same idea on both, just scaled: the longer confirmation on NQ trades some setups away in exchange for a cleaner signal, and the wider stop respects that the Nasdaq simply moves more per bar. Run together, ES and NQ produce about 1.7 trades a day — nothing exotic, nothing discretionary, which is exactly what you want when the goal is to not break a rule.
The numbers that matter for an eval
Over 130 trading days (Jan–Jul 2026), 219 trades across the two instruments:
| Metric | Result | Why it matters for an eval |
|---|---|---|
| Win rate | 93% | Smooth equity — you're rarely in a hole |
| Max drawdown | $1.3k | Never gets near the $2k limit |
| Profit factor | 4.42 | Wins outweigh losses comfortably |
| Avg $/day | $189 | ~$3k target in a few weeks |
| Green days | 88% | Consistency beats big days here |
| Every month | green | No single stretch blows it up |
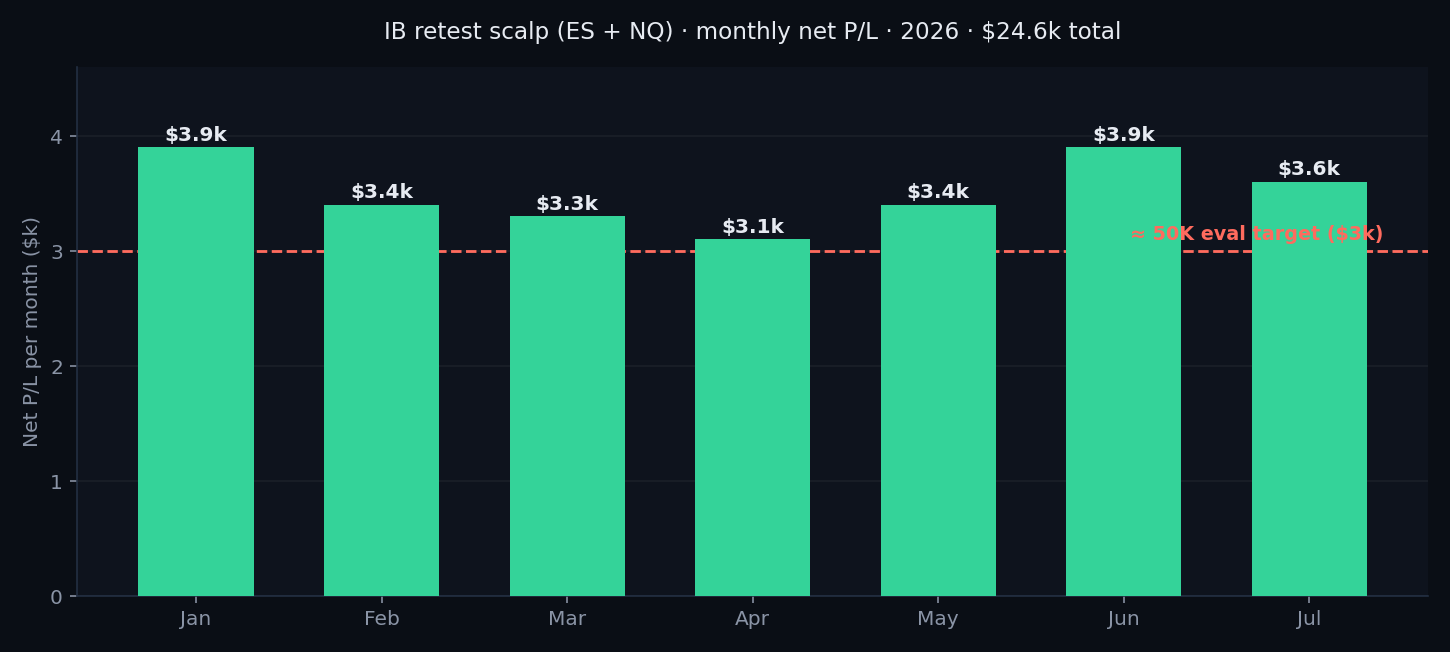
The one number to stare at is max drawdown: $1.3k against a $2k limit. The whole eval is a fight to not lose $2k, and across six-plus months of backtest the worst hole this dug was $1.3k. It's not trying to be impressive. It's trying to survive — and survival is the assignment.
The pass-rate math
The backtester models the combine two ways, and I'd trust the first one more:
- Real history — 93%. It walks the actual day-by-day sequence forward from every possible start date (121 of 130 start days would have passed), keeping real winning and losing streaks intact.
- Monte Carlo — 99%. It reshuffles the same days at random 10,000 times to remove luck-of-the-start-date. Take this as the optimistic bound.
- Median time to pass — ~17 days. Start on day one of this sample and you'd have cleared it in about 19.
But the most telling stat is how it failed when it failed:
| Failure mode | Real history | Monte Carlo |
|---|---|---|
| Blew the trailing drawdown | 0% | 1% |
| Hit the daily loss limit | 0% | 0% |
| Too slow (>60 days) | 7% | 0% |
Look at that. It basically never broke a rule — 0% blew the drawdown, 0% hit the daily limit. The only way it "failed" was running out of patience: 7% of start dates just took too long. For an evaluation, that's close to the ideal failure profile. You're not fighting to avoid disaster; you're mostly fighting the clock.
Straight from the report
None of this is my word to take — here's the actual output from the backtester, exported in full. Have a dig through it yourself:
View the full backtest report (PDF)
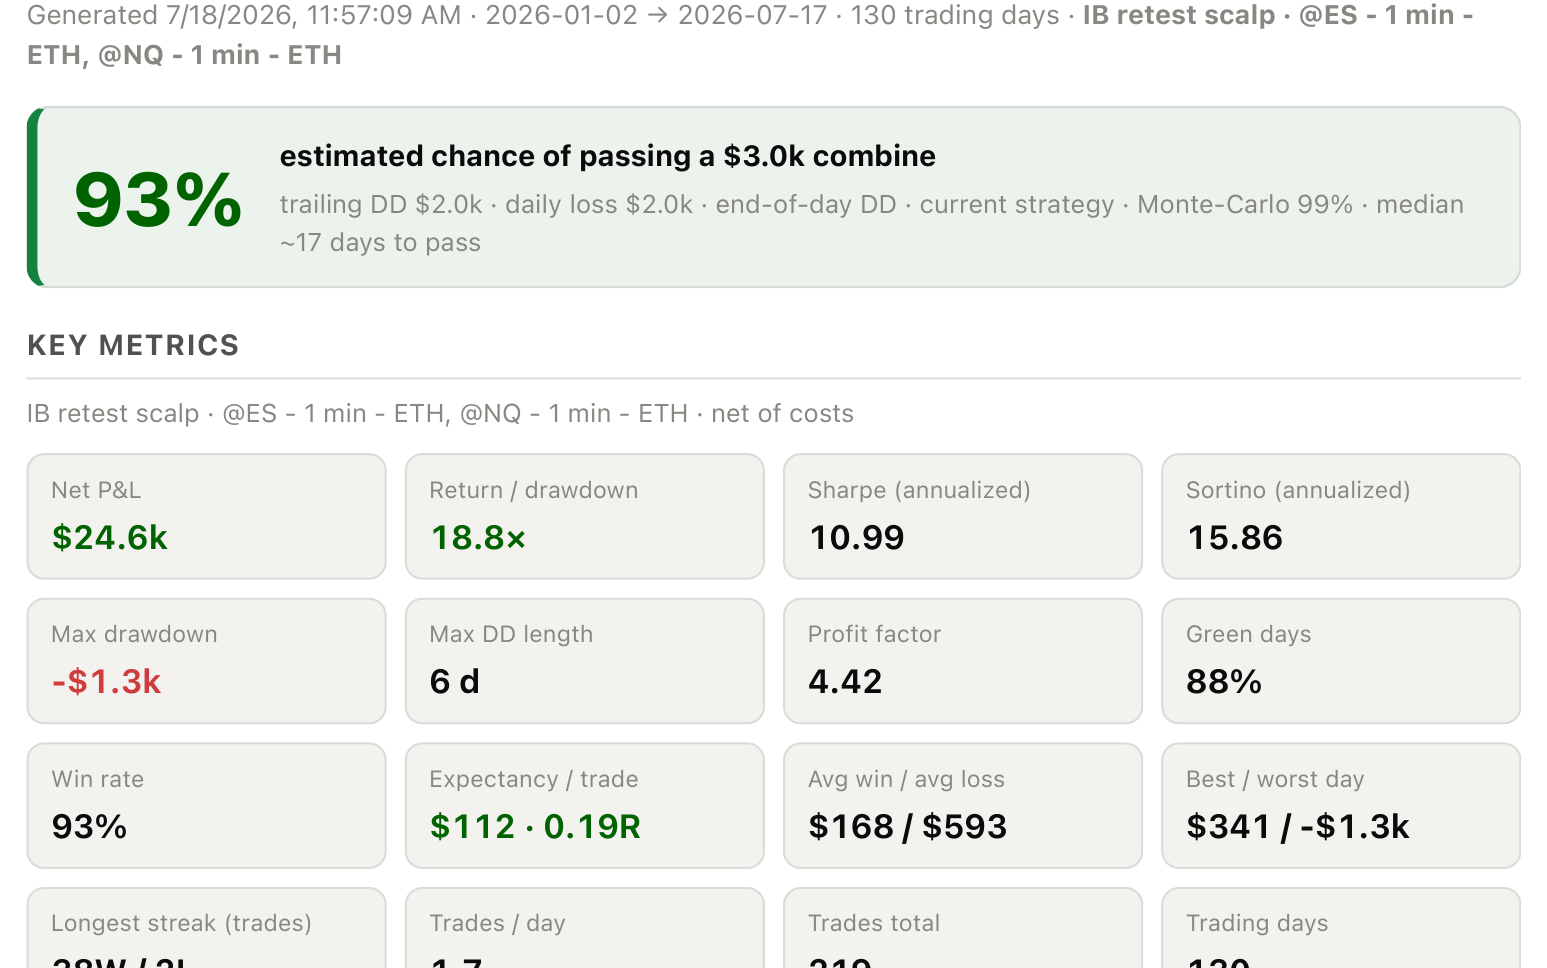
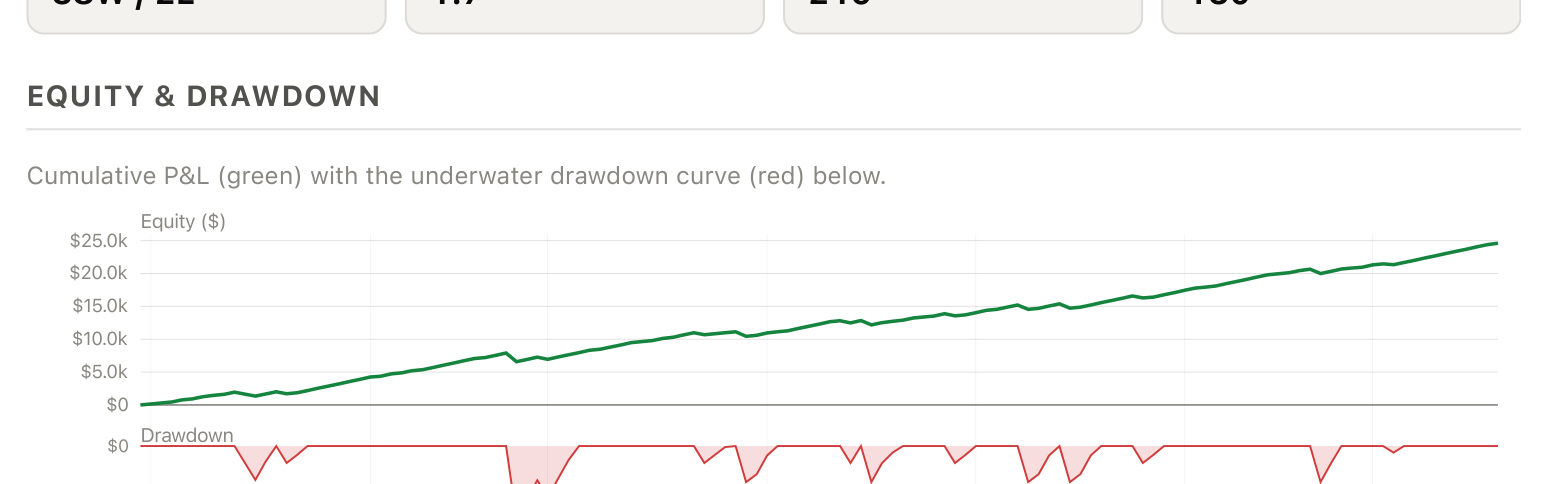
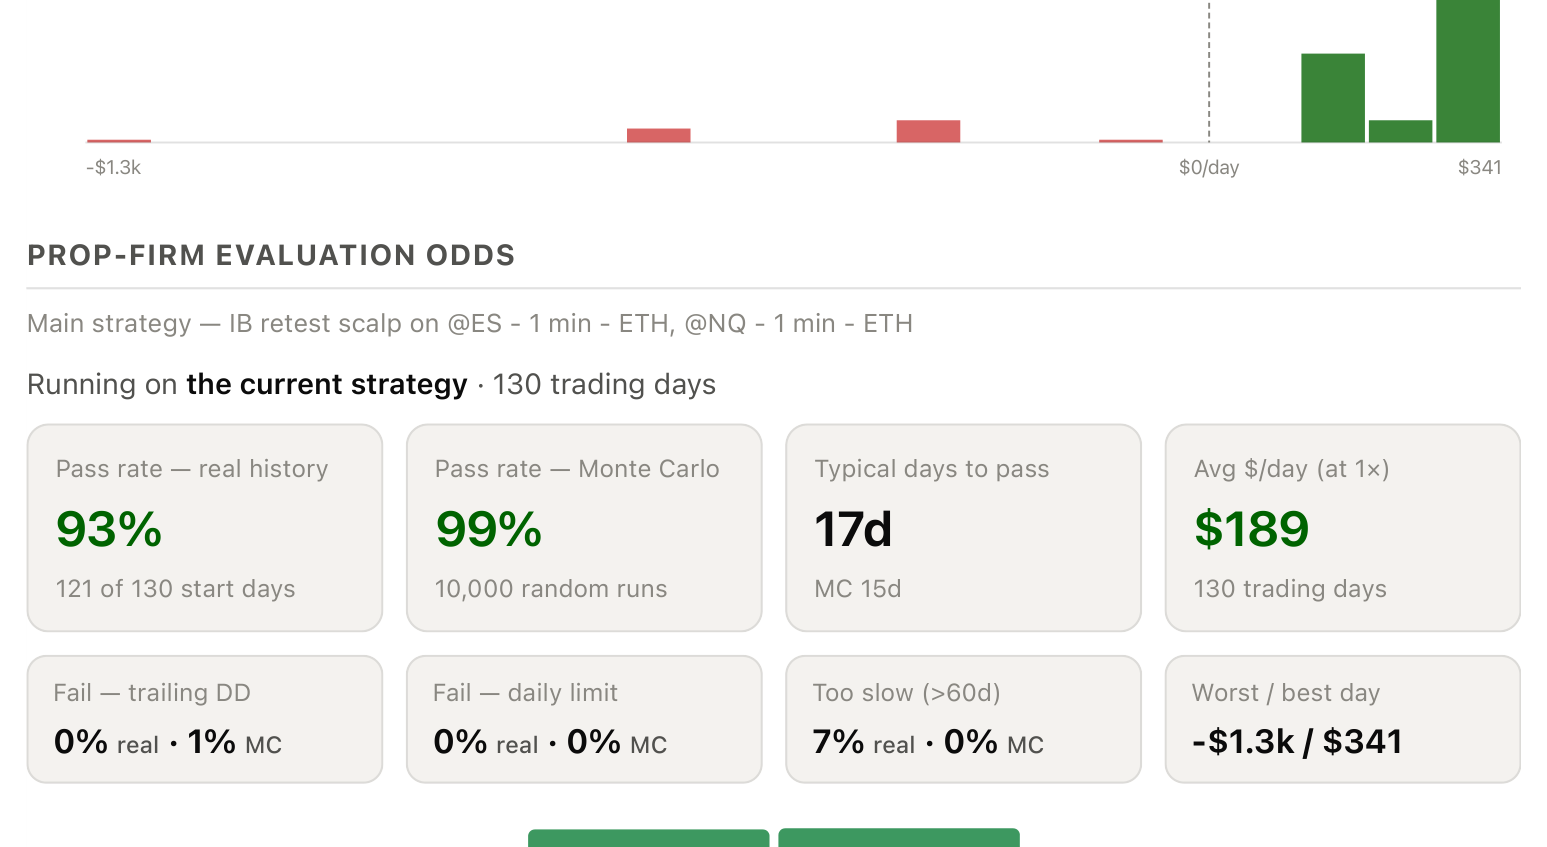
// Report images are the tool's own light-themed export. Click any to enlarge.
Now read this part twice
Everything above is the good news. Here's the fine print that actually decides whether any of it survives contact with a live account.
- One loss erases three-plus wins. Avg win $168, avg loss $593. The 93% win rate is doing all the work — the payoff ratio is 0.28×. Take one stop off, "give a trade room" once, and you can hand back a week. On this strategy, the stop is the strategy.
- The fills are optimistic. This assumes you get filled exactly at the IB level every time price touches it, with zero slippage. The tool's own docs flag level fills as optimistic. Real fills will miss and slip — and because the breakeven on a negative-R:R setup is so tight, even a small drop in win rate matters a lot.
- These odds are an upper bound. The model here checks end-of-day balances. An intraday spike that briefly pierced the drawdown or daily limit wouldn't show up. Switch the model to intraday and the pass rate comes down. Assume reality sits below 93%, not above.
- Passing isn't getting paid. The eval is the easy part. The funded stage brings consistency rules, minimum trading days, payout thresholds, and the very different psychology of real money. This gets you in the door; it doesn't make you profitable.
- Don't rush the 7%. When it's slow, it's slow. Forcing extra trades to speed up the target is exactly how you break the discipline that made it work. Patience is part of the edge.
The eval doesn't reward the best trader. It rewards the one who doesn't break a rule for a few weeks. Build for that, not for glory.
The actual takeaway
Don't copy this strategy. Copy the thinking: passing an eval is a constraints problem, and the answer is almost always simpler and smaller than people want it to be. A boring setup with a tiny drawdown, one or two trades a day, and an iron stop will out-pass a clever one that occasionally risks the account. Then test your version against the real rules — trailing DD, daily limit, intraday — before you spend a dollar on a combine.
For the record: this is a research exercise shared for educational purposes — it is not financial advice, not a recommendation, and not a promise of passing any evaluation or making any money. Backtested performance is hypothetical, has inherent limitations, and does not reflect real fills, slippage, latency, or live psychology. Prop firm rules vary — confirm your own. Futures carry substantial risk of loss; you can lose more than you put in. Trade your own plan.